Applied thinking, speculative and contemporary theory in design
REFLECTIONS ON THE LECTURES AND SOURCE MATERIAL
LECTURE
Q1: How do you visualise and develop your initial ideas?
As part of Offshores research process they take a holistic approach covering historical context to the present day to explore shapes, colours, typography, production methods and the medium of delivery. Through partner collaboration they use this organic process to gain a greater understanding of the direction and use sketches and writing which creates a framework for their personal self-initiated brief. This is a similar process to Bompass and Parr who believe in a simple two-word idea – connecting one object or idea with another, sometimes quite random, object. From a huge output of written variations of the idea and a using broad library resource they are able to distill before bringing in a sponsor or third party to help bring the idea to life. They are fairly abstract in their approach which leads me to the strange juxtapositions of Daniel Eatock as shown in the later Walker Arts Centre 'Pecha Kucha' event film. Hey Studio and Frost both start the process with analogue and digital sketching, but Vince Frost goes deeper in his of the question to gain deeper insight.
From my own perspective I would take Vince Frost's questioning process as the starting point. I think once you have a rough idea of the brief or question then this can drive the research further be it reading facts or fictions, historical or contemporary touch points which will in turn lead me onto what has been done before and is currently being done before I start any creativity.
Q2: What are your points of inspiration, theories and reference?
I found it interesting that Offshore use a 'Universal' approach when looking for inspiration that is outside of pure graphic design such as the arts themselves. I have always felt that looking at other designers work can often be counter-productive and drive a direction of sameness or imitation, and that looking outside of this area is much more rewarding and inspirational.
Like Paula Scher and Michael Wolf in module 1, Vince Frost is inspired by a sense of place and by looking, listening and questioning which goes back to environment, intuition and curiosity. Hey Studio prefer a re-inventive view of 60's and 70's graphic design, which doesn't effect the vibrancy or urgency of their output as they keep their eye on the relevant and contemporary without falling into the trap that so many designers do of following design trends. One thing that seems to be common is that each designer is passionate about one artist, thinker or style of music that they return to again and again to re-explore and reinvent for their own particular brief.
My own personal inspiration comes from the arts and from seeing an idea, image or object that is inherently clever in its execution. I love ideas and am not interested in style over substance. I also love seeing design solutions that improve lives.
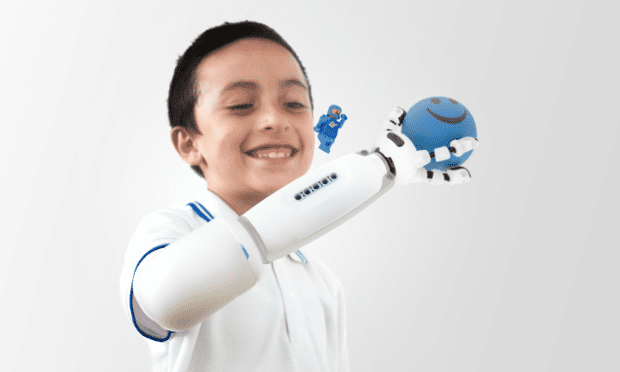
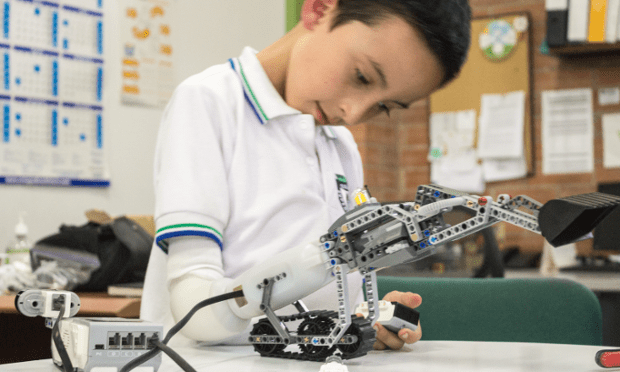
The design of bespoke arms for children without limbs (shown below) is a great example of quantifiable design ingenuity; replacing the ugly, peach, stiff NHS prosthetics and empowering disabled children with a sense that, 'yes I am different - but I am also very cool'. Practical, functional, fun and futuristic.
It's the constant re-addressing of a problem, and the new ways of execution that create connections and emotional responses that drives and inspires me.
—
RESOURCES: THE WALKER ARTS CENTRE/GRAPHIC DESIGN NOW IN PRODUCTION
TAKE OUTS
— Self initiated work is all about the making and the doing
— Take a do-it-yourself approach
— Self publishing is 'publishing yourself'
— Fulfil the human need for surprise in your work
— Look for alternative formats and materials
— Push technology and challenge the format
— Use the smallest amount of language to convey a 'big' message
— Animation is where it is at for brands today
"I grew up in a generation where our sole function was to be conscious and spread that consciousness through creative awareness, exploration, observation and questioning."
Neville Brody/Anti-Design Manifesto Excerpt
—
RESOURCES: DESIGN GENIUS/THE WAYS AND WORKINGS OF CREATIVE THINKERS. GAVIN AMBROSE.
TAKE OUTS
— Turn the ordinary into the extraordinary
— Use material learning to drive your thinking
— Design with an object in mind, even if the outcome is 2D
— Look for the unexpected and bring your own twist to it
— Don't overcomplicate the process for the end user/audience
— Storytelling and TOV are important factors in brand reinforcement
— TOV should be no-nonsense, friendly and straightforward
— Narrative is usually inhabited by 'characters' (archetypes)
— Design writing should reflect and empathise with the audience
— Storytelling should be truthful, relevant and relate to society
—Design with sustainability in mind
— Understand the processes/materials to offer eco alternatives
— put sustainability at the forefront of your business model
—
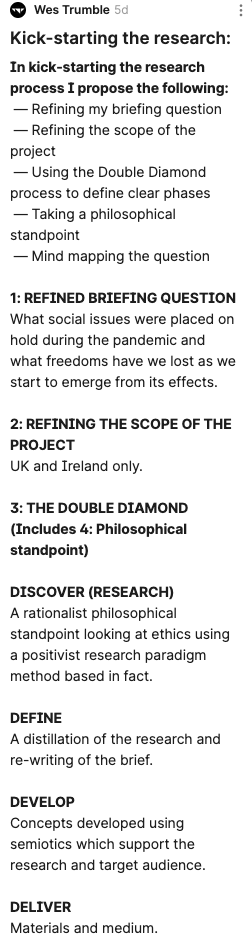
Research the subject of your self initiated project and utilise appropriate research methodologies.
In kick-starting the research process I propose the following:
— Refining my briefing question
— Refining the scope of the project
— Using the Double Diamond process to define clear phases
— Taking a philosophical standpoint
— Mind mapping the question
1: REFINED BRIEFING QUESTION
What social issues were put on hold during lockdown and what social freedoms have we lost as we start to emerge from its effects?
2: REFINING THE SCOPE OF THE PROJECT
UK and Ireland only.
3: THE DOUBLE DIAMOND (Includes 4: Philosophical standpoint)
DISCOVER (RESEARCH)
A rationalist philosophical standpoint looking at ethics using a positivist research paradigm method based in fact.
DEFINE
A distillation of the research and re-writing of the brief.
DEVELOP
Concepts developed using semiotics which support the research and target audience.
DELIVER
Materials and medium.
—
THE IDEAS WALL
I am still not 100% sure that I am using the philosophical standpoint in the correct way which was also noted by Keith as he obviously has a better grasp on this than I do. However as it is my intention to create emotional engagement with the work and have my approach rooted in fact I still believe I have chosen the right path.
MIND MAPS
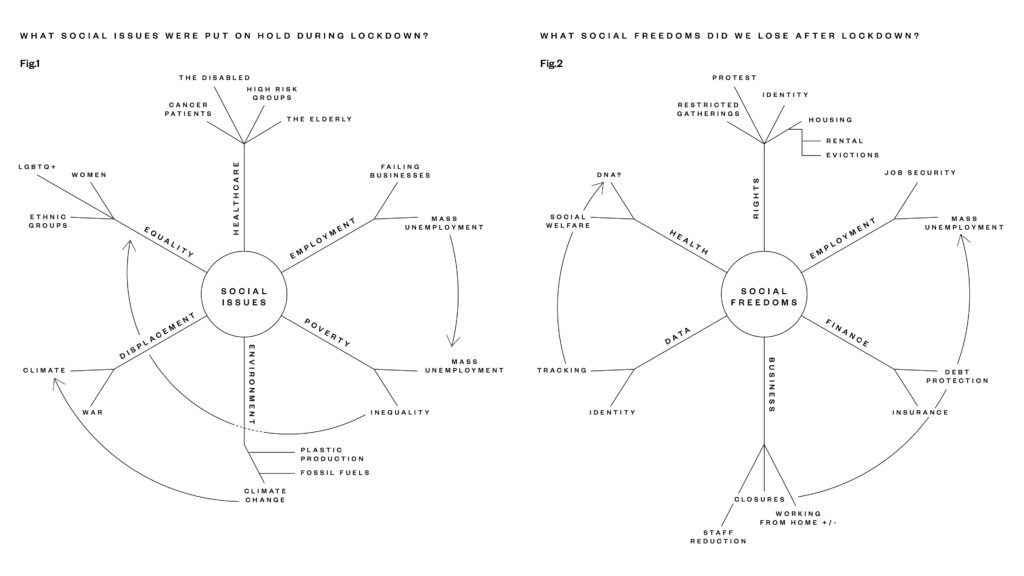
After creating the mind maps I am starting to feel that this may be too broad a subject to cover in a three week period. Therefore I propose to further research the first part of the question which I feel will give me enough information for an interesting and engaging outcome.
TOPICS FOR RESEARCH
Poverty
Employment
Healthcare
Equality
Displacement
Environment
At this stage and after doing some initial sketching I feel like I have bitten off more than I can chew but I am going to push through because if it's becoming difficult perhaps I am onto something. Hopefully the mood boards will help me to clarify my thinking.
—
Workshop Challenge
Design five different mood boards to clearly demonstrate how you might research, develop and apply your self-initiated project.
MOODBOARD RESEARCH
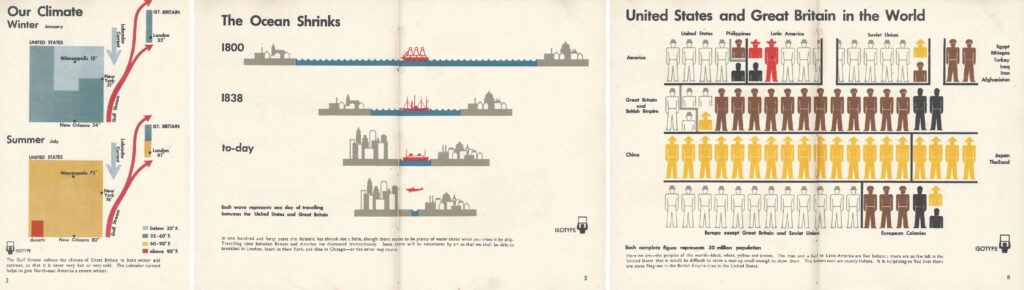
Otto Neurath and Gert Arntz
As social issues, facts and figures relate directly to my project question I was reminded of the work of Otto Neurath and Gert Arntz created for ISOTYPE way back in the 20's. The work reduced complex information systems into manageable infographics. These were playful expressions of both the content curated by the Neurath's (on a wide variety of subjects), and the graphic illustrations of Arntz.
The International System Of Typographic Picture Education (ISOTYPE) was invented by Otto Neurath in collaboration with his wife Marie Neurath, and Gerd Arntz. While assisted by many, this core Isotype team sought to create educational designs to bringing statistics alive through a visual language of modular pictograms. In 1925, Otto founded a museum in Vienna for educating the public on social and economic issues with the motto: “It is better to remember simplified images than to forget exact figures.” (Retrieved from: https://medium.com/nightingale/exploring-isotype-charts-only-an-ocean-between-part-1-399f227e1c69).
It is this distillation of information in either typographic 'sound bites', statistics or charts; coupled with iconically simple, but engaging graphics that interests me. When presenting complex statistical information to an audience where sound bites and memes are the norm; it needs to be kept as simple and as accessible as possible.
The Neurath's and Arntz collaborated with a fellow Austrian publisher, Adprint, which were sold in book format between 1941-1945. This led to the creation of a number of books that promoted cultural understanding between Britain and its allies during the war. Arntz, a German-born artist helped refine the aesthetics of ISOTYPE by applying his modernist design sensibilities. (Retrieved from: https://medium.com/nightingale/exploring-isotype-charts-only-an-ocean-between-part-1-399f227e1c69).
In revisiting this work, it is amazing how vital and fresh the presentation of the information remains to this day, and in my own view, is the starting point for all designers when developing engaging, understandable and dynamic infographics.
—
INITIAL STATISTICAL RESEARCH
POVERTY
— 689 million people; live in extreme poverty, surviving on less than $1.90 a day.
— Children and youth account for two-thirds of the world’s poor, and women represent a majority in most regions.
— Extreme poverty is increasingly concentrated in sub-Saharan Africa. About 40% of the region’s people live on less than $1.90 a day
— Extreme poverty rates nearly doubled; in the Middle East and North Africa between 2015 and 2018, from 3.8% to 7.2%, mostly because of crises in Syria and Yemen. — Although countries impacted by fragility, crises, and violence are home to about 10% of the world’s population, they account for more than 40% of people living in extreme poverty. By 2030, an estimated 67% of the world’s poor will live in fragile contexts.
— About 70% of people older than 15 who live in extreme poverty have no schooling or only some basic education.
— 1.3 billion people in 107 developing countries, which account for 22% of the world’s population, live in multidimensional poverty. About 84.3% of multidimensionally poor live in sub-Saharan Africa and South Asia.
— 644 million children are experiencing multidimensional poverty.
(Retrieved from: https://www.worldvision.org/sponsorship-news-stories/global-poverty-facts).
—‚
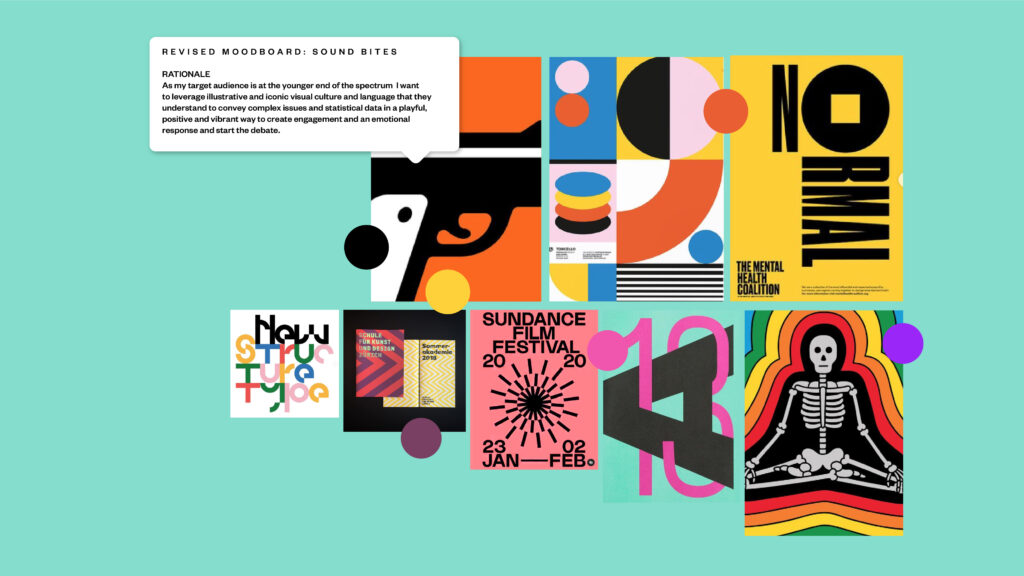
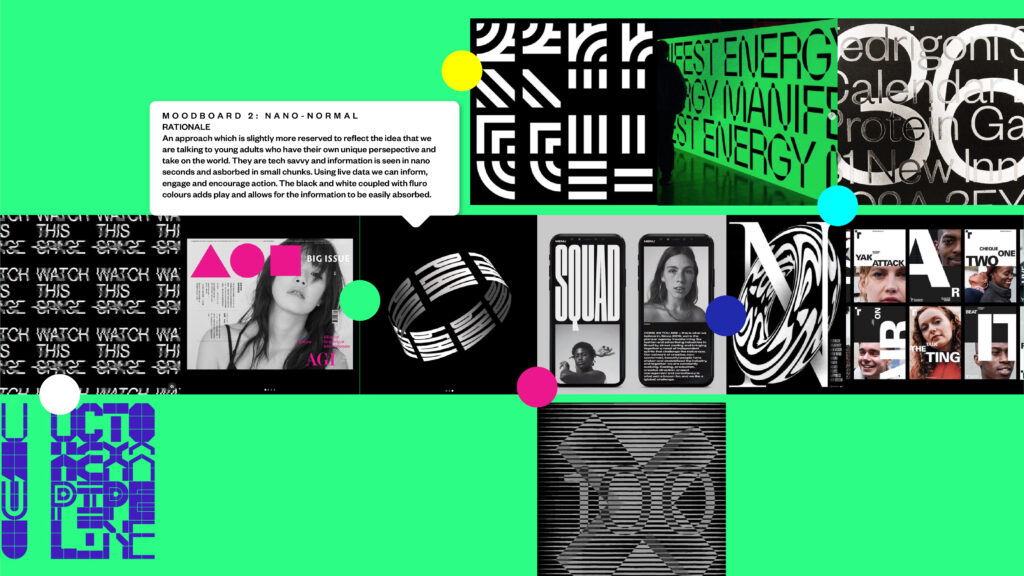
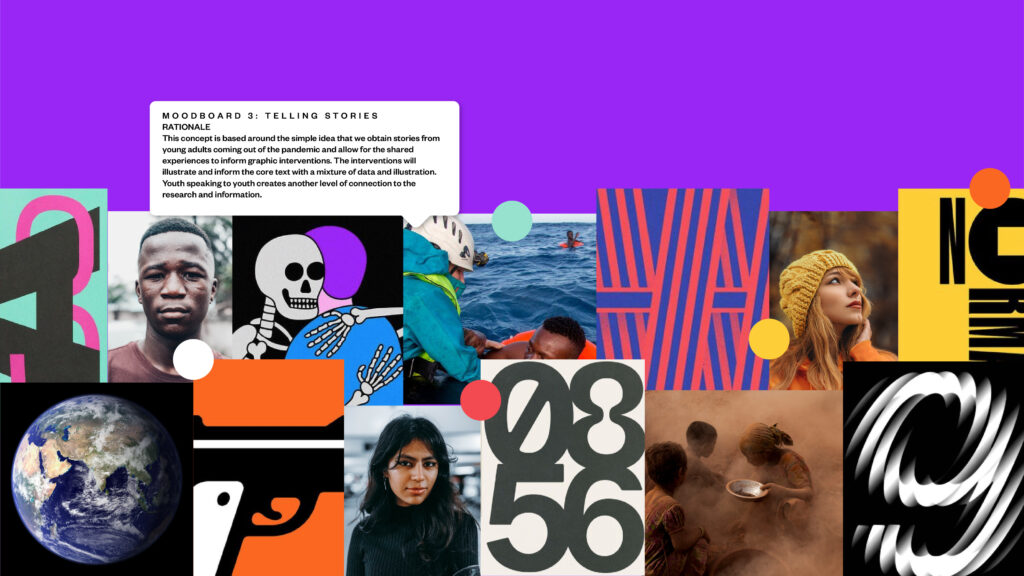
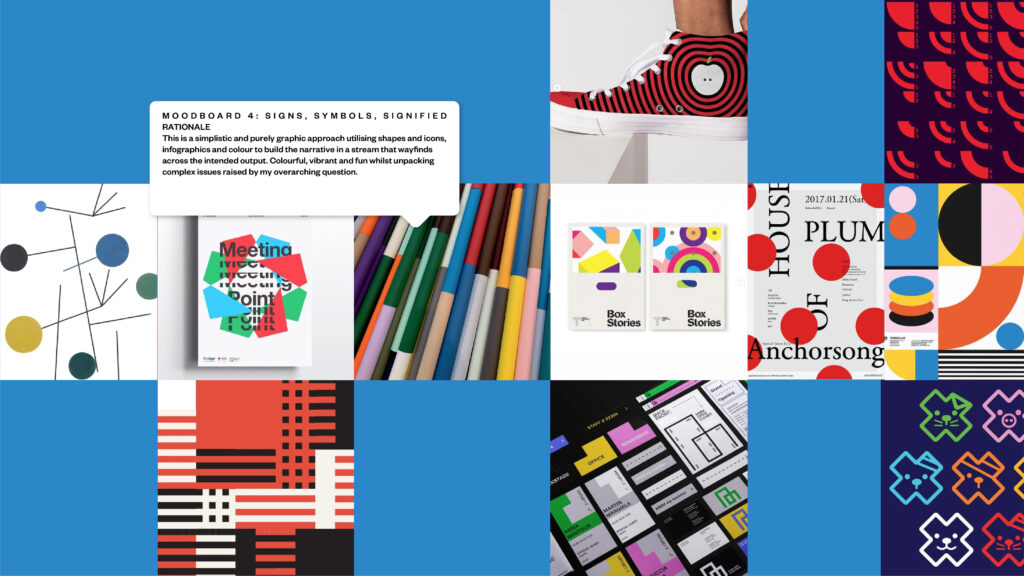
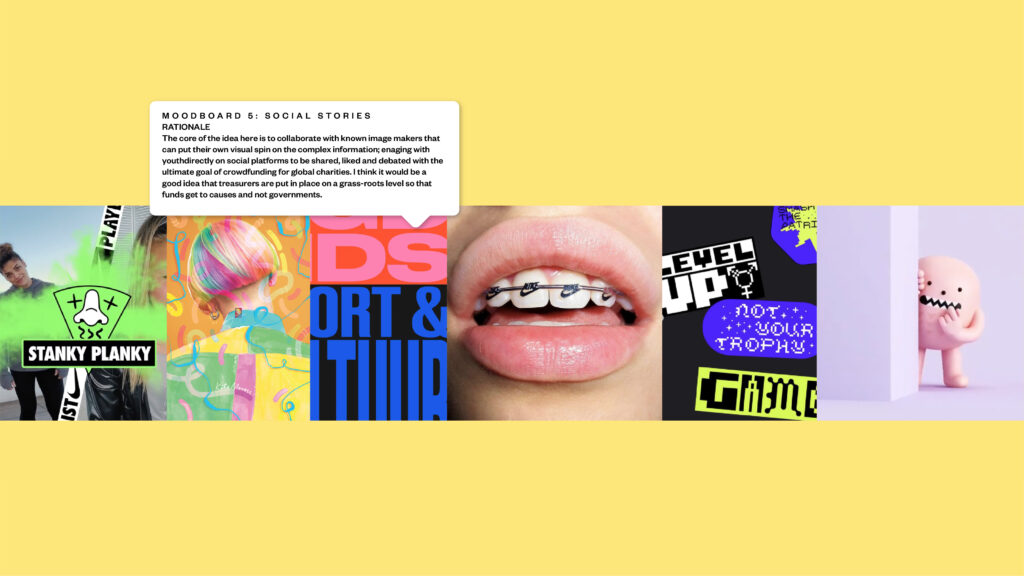
MOODBOARDS
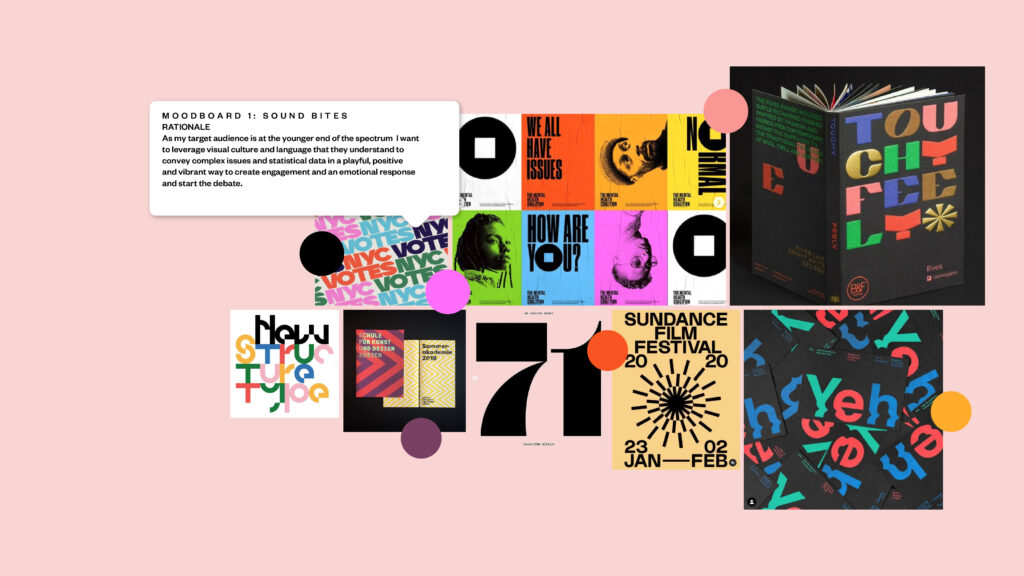
THE IDEAS WALL
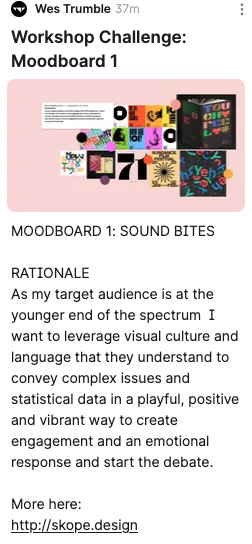
The best responses were towards mood board 1 so I will explore this in my sketching process. I am still torn between 1 and 3 as I am drawn to the illustration on mood board 3. It combines dark subject matter with humour which I think fits with my brief where complex issues raised during lockdown require a draw for my target audience.
FURTHER RESEARCH AND REVISITING THE QUESTION
After creating the mood boards it has helped me to refocus my thinking:
Firsly I propose to flip the two part question and use the first part as an introduction.
1: REFINED BRIEFING QUESTION VERSION 3
What social freedoms did we lose during lockdown and what social issues were put on hold?
Using the mind maps I am now able to write a short introduction for the piece:
The world has been affected by unprecedented times. The first global pandemic in 100 years placed restrictions on freedoms in an effort to contain the infection. As the West starts to emerge from this; what social freedoms did we lose and what issues were put on hold? Did we give up our anonymity with tracking apps, potential DNA harvesting and now, covid passports?
As the doors open and we start to pay the bills, how many people will lose their homes and livelihood? Did working from home really empower the way we work or has it become a cover for a silent culling of the workforce?
We can't answer all of these questions as we are still effectively in the pandemic, but by taking a small snapshot, we can explore some of the social issues that were top of mind that affected people during this time of local, international and global concern.
—
I am reaching out to the National College of Art and Design in Dublin with a series of questions to ask students what their personal take is on this.
—
PART TWO: Facts and Stats
RACISM
“The pandemic continues to unleash a tsunami of hate and xenophobia, scapegoating and scare-mongering”
"People have been punched in the face and taunted, accused of spreading coronavirus".
— UK police forces showed at least 267 anti-Asian hate crimes recorded between January and March. The figures for the first three months of 2020 were higher than all of 2018 or 2019. (Retrieved from: https://www.hrw.org/news/2020/05/12/covid-19-fueling-anti-asian-racism-and-xenophobia-worldwide).
…
Marcus Rashford said he had received more than 70 abusive messages following his team’s defeat in the Europa League final against Villarreal.
“I’m more outraged that one of the abusers that left a mountain of monkey emojis in is a maths teacher. He teaches children!!!".
.“We all wear the same shirt and kick the same ball. I’m built for criticism of my performance but I can’t accept the ape, monkey, baboon, banana, jungle talk".
(Retrieved from: https://www.theguardian.com/football/2021/may/27/marcus-rashford-receives-racial-abuse-social-media-after-europa-league-loss).
— During the pandemic black people in London were ‘up to over 11 times’ more likely to be stopped by police than white people.
(Retrieved from: https://www.manchester.ac.uk/discover/news/covid-lockdowns-exacerbated-racist-policing).
...
HEALTH CARE (CANCER AND THE DISABLED).
CANCER
— 42% of cancer patients and survivors reported experiencing some level of care disruption.
— 43% of healthcare workers reported atypical delays in delivering cancer care
— 50% agreed that patient access to research and clinical trials had been reduced.
Citation: Edge R, Meyers J, Tiernan G, Li Z, Schiavuzzi A, Chan P, et al. (2021) Cancer care disruption and reorganisation during the COVID-19 pandemic in Australia: A patient, carer and healthcare worker perspective. PLoS ONE 16(9): e0257420. https://doi.org/10.1371/journal.pone.0257420.
DISABILITY
"Millions spent months shielding, battling for basic support healthcare, supermarket deliveries, financial support and social care," said James Taylor, executive director at disability equality charity Scope.
"Horrifying reports of do-not-resuscitate orders were placed on people without their consent left many fearing they'd not get treatment if they caught the virus".
(Retrieved from: https://www.bbc.com/news/uk-57652173).
— In the United Kingdom the risk of death from COVID-19 was 2–3 times higher than that for non-disabled people.
Australia does not mention disabled people in its COVID‑19 emergency-response plan (A. Kavanagh et al. Disabil. Health J. 14, 101050; 2021).
(Retrieved From: https://www.nature.com/articles/d41586-021-02233-y).
...
POVERTY
—‚The COVID-19 pandemic is estimated to push an additional 88 million to 115 million people into extreme poverty this year.
— Extreme poverty, defined as living on less than $1.90 a day, is likely to affect between 9.1% and 9.4% of the world’s population in 2020, according to the biennial Poverty and Shared Prosperity Report.
— Had the pandemic not convulsed the globe, the poverty rate was expected to drop to 7.9% in 2020.
(Retrieved from: https://www.worldbank.org/en/news/press-release/2020/10/07/covid-19-to-add-as-many-as-150-million-extreme-poor-by-2021)
—Poverty headcounts will be at least 500,0000 higher in 25 countries compared with pre-COVID-19 trends.
(Retrieved from: https://www.brookings.edu/blog/future-development/2021/06/02/long-run-impacts-of-covid-19-on-extreme-poverty)
...
MIGRATION
— Globally, policymakers have overlooked the challenges faced by international migrants in host countries during the Covid-19 pandemic.
(Retrieved from: https://onlinelibrary.wiley.com/doi/full/10.1111/1467-8551.12512)
— Where did all the migrants go?
— Covid-19 has seriously affected migration data. Key questions about the nature and scale of migration to the UK are more uncertain.
‚— The International Passenger Survey was suspended in March 2020.
(Retrieved from: https://migrationobservatory.ox.ac.uk/resources/commentaries/where-did-all-the-migrants-go-migration-data-during-the-pandemic).
— For non-EU nationals, there were 1.29 million working in the UK in July to September 2020. This was 65,000 fewer than the previous year (5% lower).
(Retrieved from: https://www.ons.gov.uk/peoplepopulationandcommunity/populationandmigration/internationalmigration/articles/
internationalmigrationandmobilitywhatschangedsincethecoronaviruspandemic/2020-11-26).
...
CLIMATE CHANGE
— China, Italy, the UK, Germany and dozens of other countries are experienced temporary falls in carbon dioxide and nitrogen dioxide of as much as 40%.
— In China, the world’s biggest source of carbon, emissions were down about 18% between early February and mid-March 2020 – a cut of 250m tonnes.
— Road traffic fell in the UK by more than 70%
(Retrieved from: https://www.theguardian.com/world/2020/apr/09/climate-crisis-amid-coronavirus-lockdown-nature-bounces-back-but-for-how-long).
— Rhino poaching declined in Tanzania due to disruption of supply chains and restrictions on cross-border movements.
— Deforestation in Brazil hit a 12-year high.
— It was projected in Europe that there would be at least 11,000 fewer fatalities from air pollution. Breathing cleaner air also meant 6,000 fewer children developing asthma, 1,900 avoiding A&E visits and 600 fewer being born preterm.
— In the UK, 2 million people with respiratory conditions experienced reduced symptoms.
— Sluggish economic activity reduced global greenhouse gas discharges by an estimated 7%, the sharpest annual fall ever recorded.
—
Imagine a range of concepts to inform the visual direction of your self initiated project.
I started sketching out concepts based on my five mood boards with the intention of re-visiting the mood board post sketching. This has helped me define areas of interest I want to pursue with the final design piece using illustration, type and iconography. I did further sketches for concepts but couldn't really come up with a clear direction for a fifth sketch so have stuck with what you see below.
SKETCHES
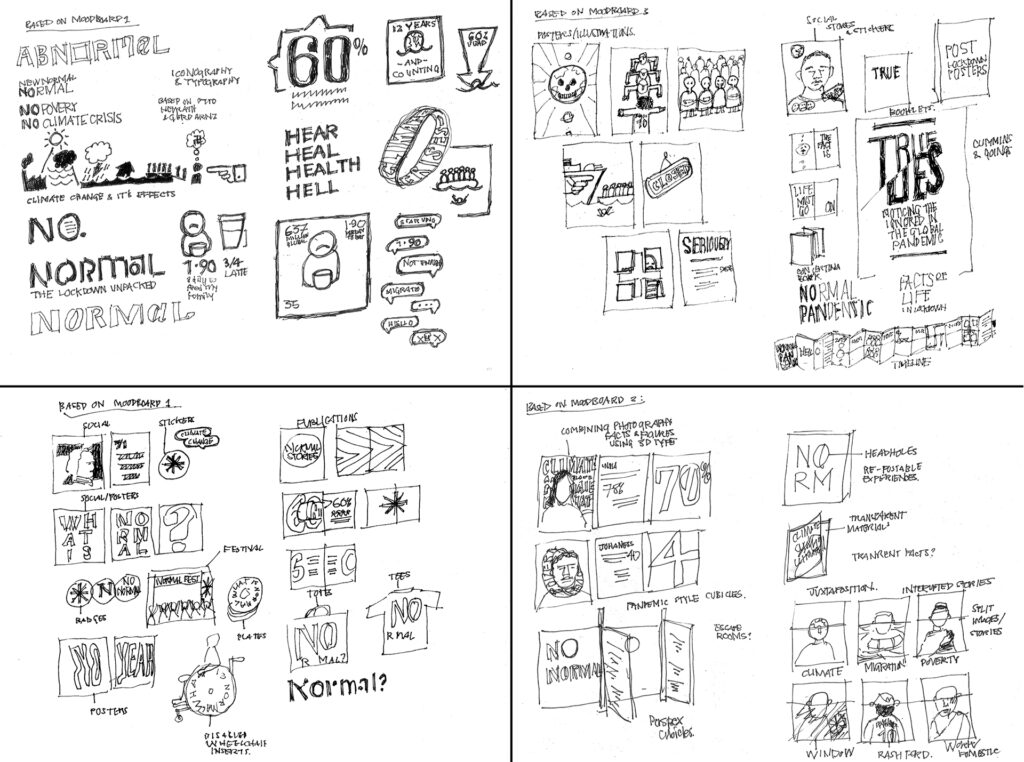
TOP LEFT: Using mood board 1 as the jumping off point I explored the idea of creating simple icon graphics to explain complex facts. I was influenced both by the mood board and the work of Otto and Marie Neurath and Gerd Arntz. I think this bold graphic style can also influence the typographic outcome.
TOP RIGHT: Based on the illustration style on mood board 3 I have explored the idea of creating engaging and striking visuals that when combined with icons and statistical facts can form the basis for both online and offline communications.
BOTTOM LEFT: This is more of a combination of graphic and visual elements from Mood board 1 with a broader view of the outcome. This can take the form of offline and online communication, merchandise, audience participation and a festival with the view to creating revenue for the relevant causes.
BOTTOM RIGHT: A combination of graphic elements from mood board 2 and mood board 3 where imagery and type interact with each other to create striking juxtapositions.
In exploring the above options I am looking to create work that uses both iconography and illustration as I think it will be the most effective way to engage with my target audience. As a direct result of this I am also going to refine my mood board for the final outcome.
—
REVISED MOODBOARD (More Iconic and Illustrative)