
Projecting a new perspective
REFLECTION ON LECTURES AND RESOURCES
In Joe's lecture he covers in detail the complexities of researching information and data using, data sets, context, trends, research bodies, trend forecasting and analytics. He also goes into detail about the ways in which 'truthful' data is captured only to be, (in the absence of data analysts and statisticians) manipulated by media and politicians for their own bias.
He asserts that effective information design has the power to be both transformative but can also have social consequences if harnessed and used in the wrong way. The examples shown tell us the bias story in all it's negative forms; whether it be Nigel Farage using the migrant story to entice voters to vote for his right wing party, the distortion of the media in their carefully de-contextualised soundbites or the use of visual stimulus by the press. The camera doesn't lie, but it is manipulated and used in the same way data is used for the same effect. It is interesting here that the same paper (The Daily Mail) poisons the conversation using the migrant story to drum up support for Brexit one week only to have to backtrack and tell to the real story in another when a boy is photographed washed up on the English coast. It was upsetting to hear that migrant's themselves are becoming weary of who they share information with because of the way it has been manipulated and shows a collective awareness of how they have been presented to the wider world.
So it is of paramount importance as a designer that you contextualise your research, information and data to present a rounded and unbiased view. Offshores Migrant magazine was set up for this purpose and with each issue the explore in-depth the different variables that have caused these displacements in the first place as well as the complexity of situations that arise during an individuals decision to migrate. This can take many forms such as climate change, war, a regions resources and sadly, the predatory nature of traffickers and criminal gangs.
Forensic Architecture use spatial design platforms to uncover and understand historical, recent and current human rights abuses using their data sets to change government perceptions, provoke reaction and promote systematic change and it is great to find that advocacy groups are involved to ensure the voices of migrants are not lost on their journey towards a better life.
Joe highlights the need for designers to collaborate with a multi-disciplinary field when data gathering such as scientists, artists, data analysts and statisticians. This enables you to create informed narratives. He also touches on using historical, recent and current resources and to look on a local, international and global level. This level of data gathering enables you to present that rounded view and helps you to define which issues are important and what is not to focus on a particular issue.
Context is also an important part of this research journey. Migrant, Forensic Architecture and The New York Times long reads use a combination of editorial, images and information graphics to build a rounded view. As Joe asserts: ", Information design supports the text, the text supports the images and images bring data to life".
TAKE OUTS
— Contextualise to create meaningful design.
— Your information design can be transformative, so ensure it has zero bias.
— Collaborate with multidisciplinary experts in the field: Scientists, Forecasters, Data Analysts, Researchers, Statisticians…
— Use editorial, images and information graphics to visualise and support a rounded viewpoint.
— Historical, recent and current data can reveal patterns and give insight and understanding.
— Research locally, internationally and globally.
— Alternative methods can be used to present data in a sculptural or public way.
—
AN EXAMPLE OF SUCCINCT INFOGRAPHIC DESIGN
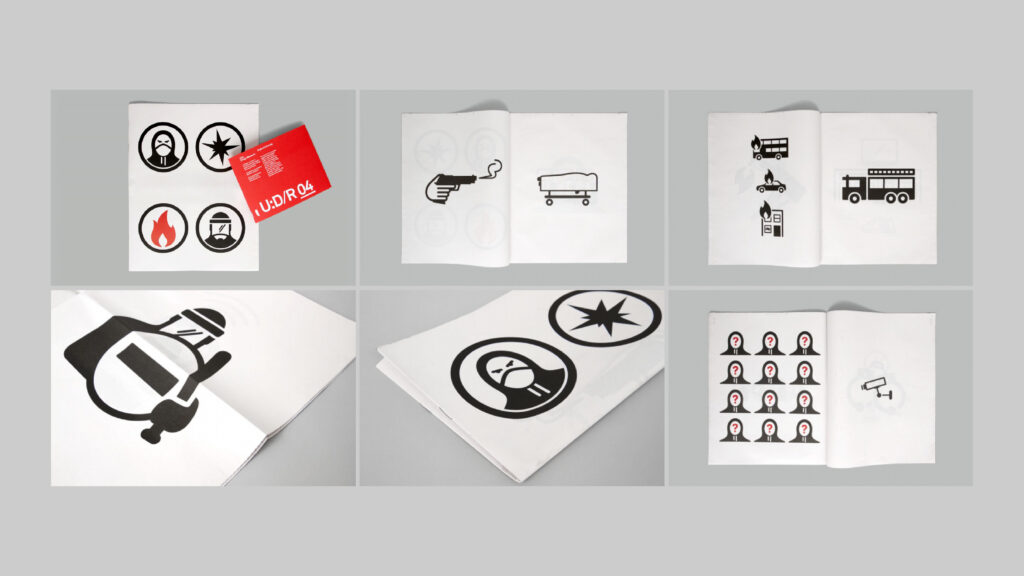
Fields piece on the London Riots made me think of work created by Stephen McCarthy for Unit Edition. England's Burning is a pictorial account of the 2011 England Riots by Dublin-born graphic designer Stephen McCarthy. The illustrated newspaper is available for sale at Unit Editions (Retrieved from:https://www.aa13.fr/design-graphique/englands-burning-stephen-mccarthy-13068). McCarthy distilled the events as they evolved into a series of pictograms which in their Margaret Calvert influenced simplicity, give all the data and information you need to gain understanding. A direct, playful and graphic solution depicting serious events.
—
Workshop Challenge
Source a scientific, cultural or environmental story that matters to you.
Some ideas for my Cultural, Scientifc or Environmental research:
1) Downing Street Parties: Attendance, Number, Key Dates, Times, Alcohol Consumed... might have to give Sue Gray a call as I'm not sure all the data is in.
2) Covid app effectiveness/use vs cost.
3) Build up to war in Ukraine: Dates, Troops, Locations, Nature of Exercises...
4) Innacuracies in films when portraying the Royal Family (Lol)...
5) Meteorite entering the earths atmosphere: Dates, Power of Impact, Destruction, Location, Meteorite composition...
—
THE IDEAS WALL
Shinna liked the direction of my 2nd option but I think I prefer option 5 as there could be some interesting data related to the subject matter. I am also partly inspired by the Accept and Proceed poster on moon landings which may or may not influence my outcome.
—
Data Gathering
EARTH IMPACT EVENTS
The event of an object enter the earth's atmosphere is scientifically referred to as and impact event. Asteroids, comets and meteoroids regular enter the earth's atmosphere with minimal consequences due to the protection afforded by the earth's atmosphere. However, according to WikiPedia: 'When large objects impact terrestrial planets such as the Earth, there can be significant physical and biospheric consequences'. (Retrieved from: https://en.wikipedia.org/wiki/Impact_event). The most significant impact event that most of us are aware of are the Big Bang' itself which led to the creation of our own Solar System and start of evolutionary life on Earth, and of course the meteorite impact that wiped out the dinosaurs 66 million years ago.
According to WikiPedia, asteroids with a 1 km (0.62 mi) diameter strike Earth every 500,000 years on average, whereas large collisions – with 5 km (3 mi) objects – happen approximately once every twenty million years. (1).
As asteroids enter the Earth's atmosphere they are broken apart into 'Airbursts' fragmenting asteroids of 7m in diameter into smaller pieces which are generally burnt up in the atmosphere. Asteroids of 20m strike the earth at least twice every century causing an explosion 30 times more powerful than the bombs that were dropped on Hiroshima. For instance, in 2013, an 20m asteroid event called the Chelyabinisk event entered the earth's atmosphere with over 1000 people injured by the airburst. According to WikiPedia: 'Astrogeologists have determined that during the last 600 million years, the Earth has been struck by 60 objects of a diameter of 5 km (3 mi) or more'.(1) The impacts cause leave large craters, which are also used to determine the size and speed of the impact among other data.The smallest of these impactors would leave a crater almost 100 km (60 mi) across. Only three confirmed craters from that time period with that size or greater have been found: Chicxulub, Popigai, and Manicouagan, and all three have been suspected of being linked to extinction events. (1). It is thought by scientists that when asteroids enter the ocean they explode on impact. It is widely thought within the scientific community that if an impact such as this would occur may cause a megatsnunami. This has also been disputed.
Meteoroids are particles of asteroids and are generally smaller being 1m in diameter and rarely have an impact on Earth. If they reach landfall they are referred to as meteorites.
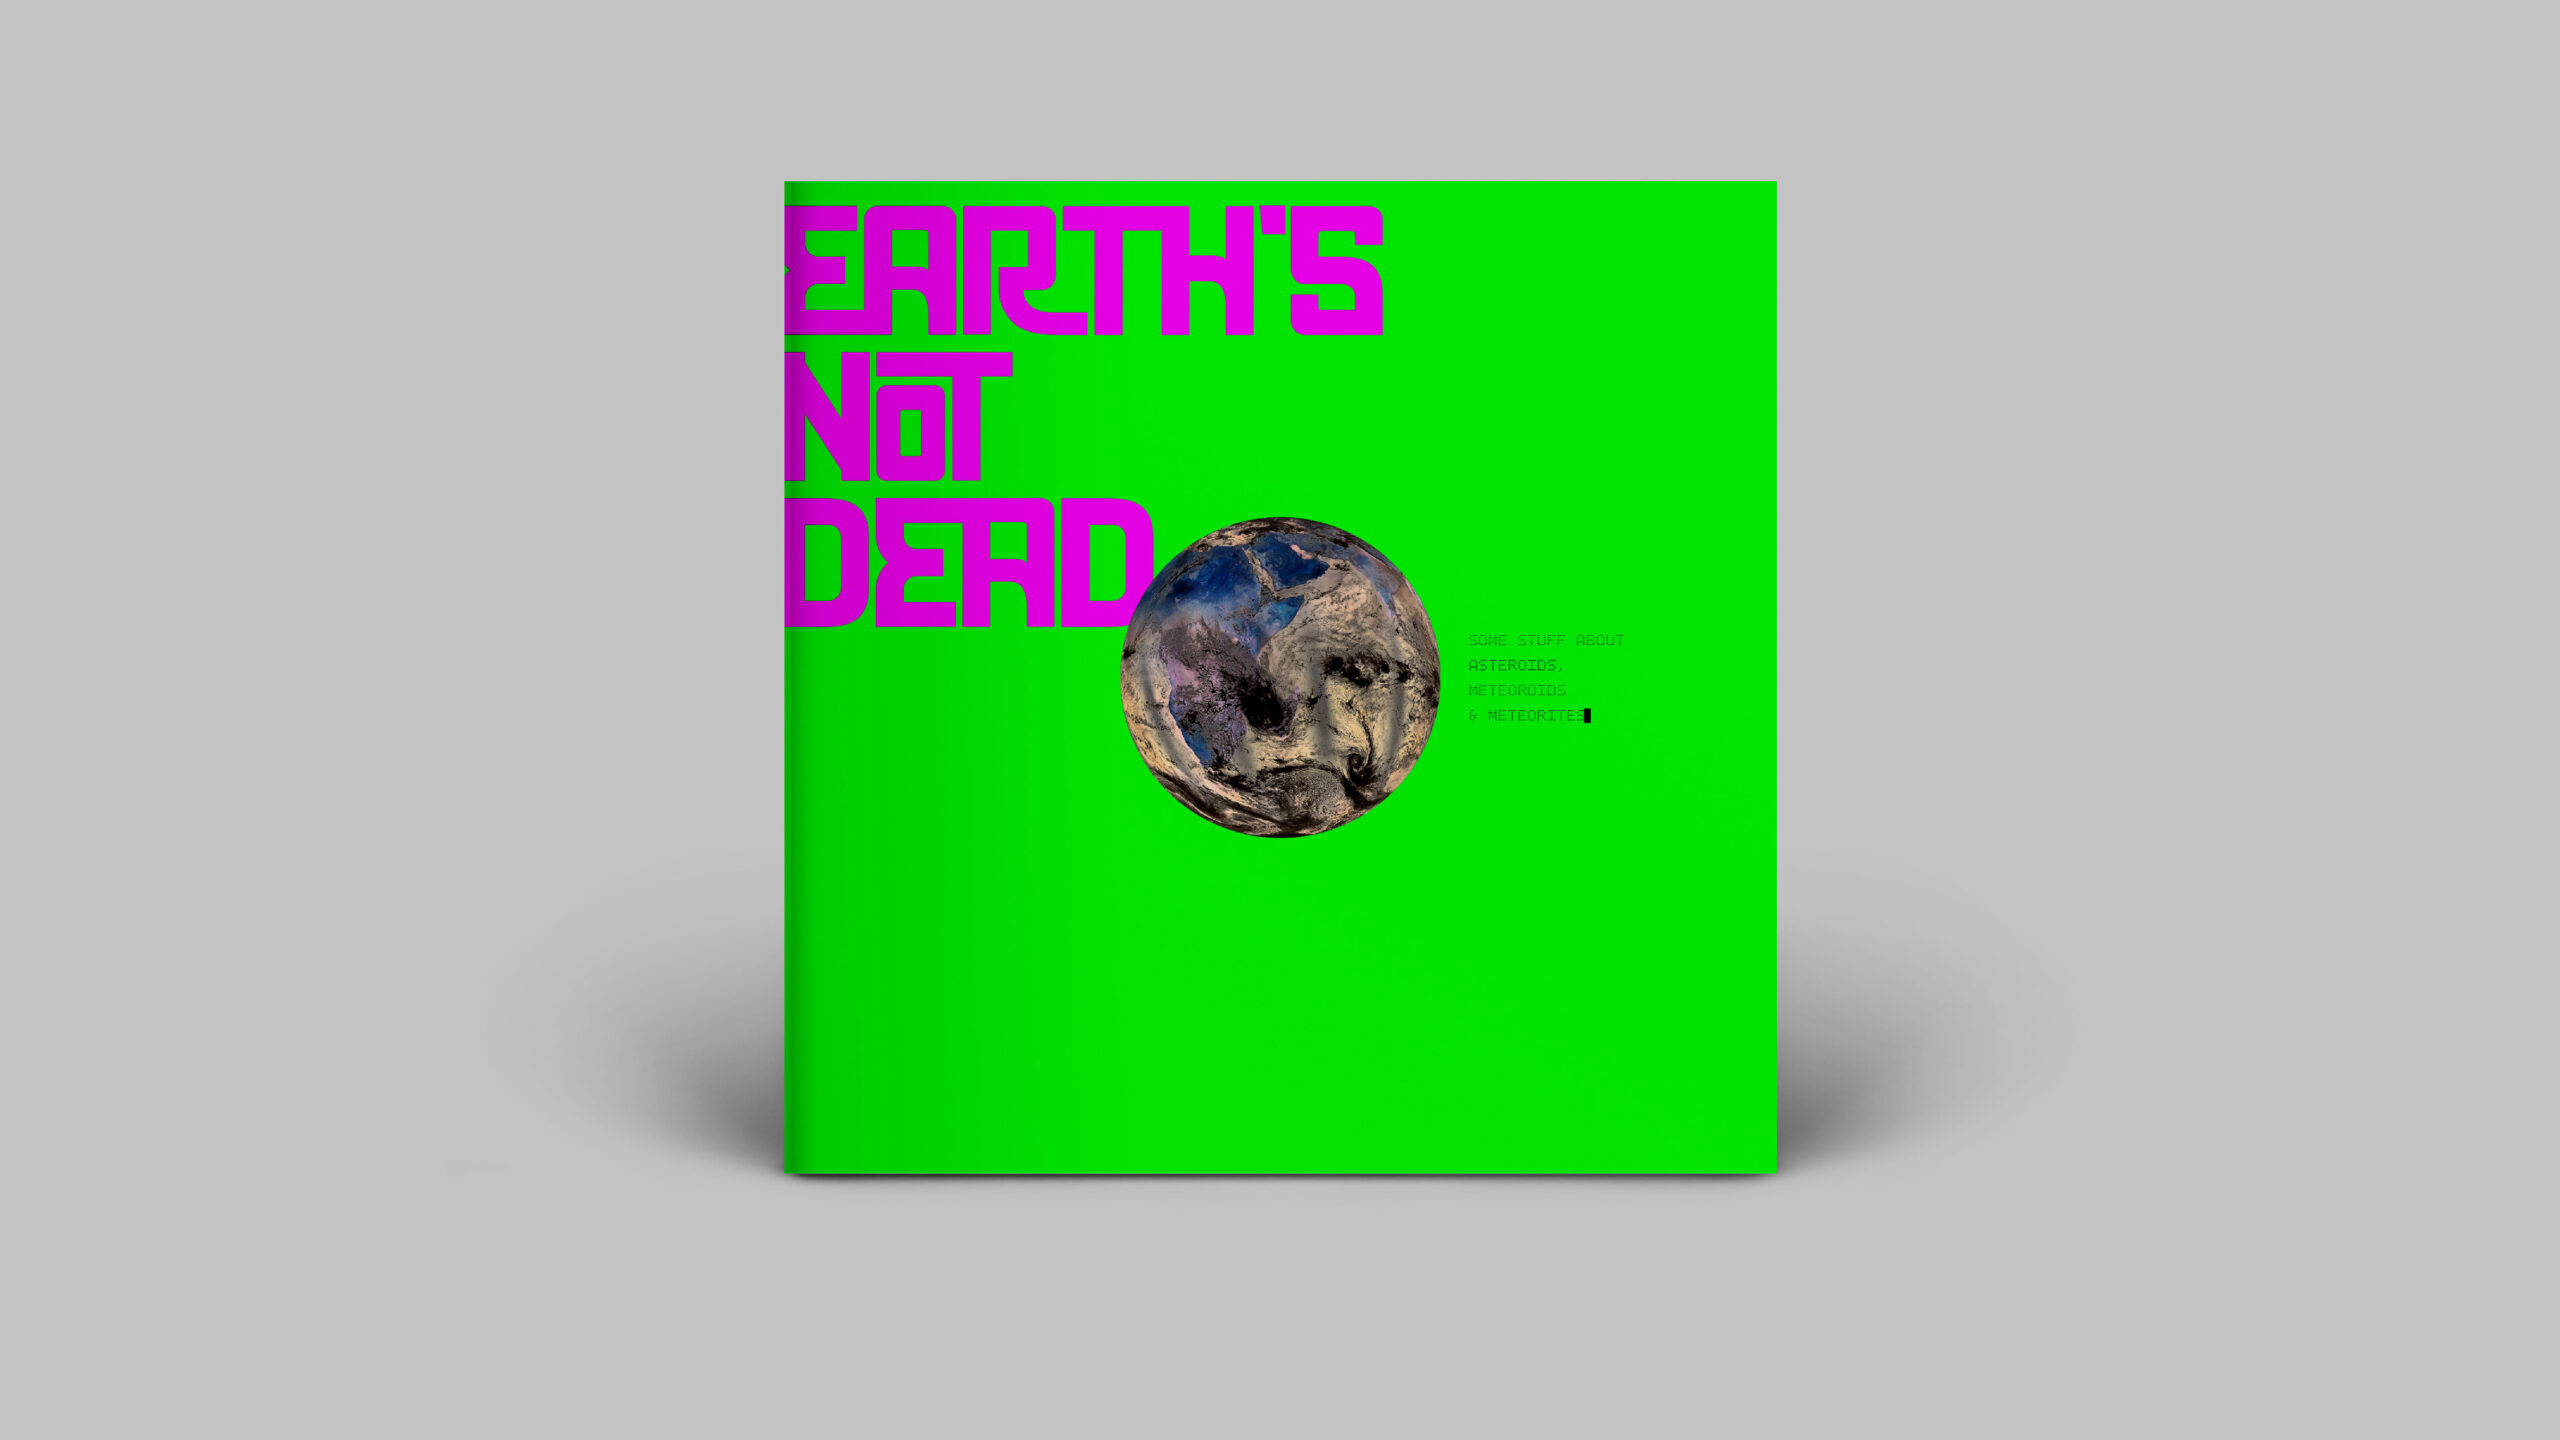
Note: In conducting my research I have discovered the difference between Asteroids, Meteoroids and Meteorites. As Asteroids cause the most significant change to planet earth I have decided to shift my focus onto Asteroid impacts.
—
SIGNIFICANT EVENTS (DISCOVERED)
1) Chicxulub Crater, Yucatan Peninsula, Mexico. 66 million years ago. Triggered the extinction of the dinosaurs.
2) Tunguska (Siberia), 1908.
3) Chelyabinisk event. 2013.
4) Barringer Crater, Arizona.
5) Popigal Crater.
6) Manicouagan Crater.
7) Mistatin Crater.
8) Elatin Impact.
9) Permian Triassic, 250m years ago. Killed 90% species.
10) Kaapvall Craton, South Africa (Barberton Greenstone Belt). 3.26 Billion Years ago.
11) Pilbara Craton (Western Australia).
12) Yarrabubba Crater, Yilgarn Craton, Western Australia). 2.2 billion years ago.
13) Vredefort, Kaapvall, South Africa.
14) Sudbury Impact Event, Canada. 1.849 billion years ago.
15) Western Warburton and East Warburton Basins, Australia.
16 Lonar Crater Lake, India. 52,000 years ago.
17) Rio Cuarto Craters, Argentina. 10,000 years ago.
18) Campo Del Ciel,o Argentina (bordering Chaco Province). 4,000-5,000 years ago.
19) Whitecourt Crater Alberta, Canada. 1,080-1,130 years old.
20) Chi'ing Yang Event. 10,000 people killed by hail of falling stones. 1490.
21) Sikhote-Alin Mountains, Primorye. Soviet Union. 1947.
22) Sylacauaga, Alabama. 1954.
23) Pribram Meteorite, Czechkoslovakia. 1959.
24) Allan Hills 84001, Antartica. 13,000 years ago.
25)‚ Morokweng South Africa, Kalahari Desert.
26) Acraman Crater South Australia.
27) Woodleigh Crater.
28) Morokweng Crater, North Western South Africa.
29) Kara Crater.
30) Popigai Crater, Russia.
31) Chesapeake Bay Crater, Virginia U.S.A.
—
I propose to come up with a simple table to capture the data first before proceeding with a planned design. I will also look to see if I can gain any new insights from the data, however, given that the data is scientific I would be surprised if my own rudimentary conclusions tell us anything new that scholars have not already discovered themselves.
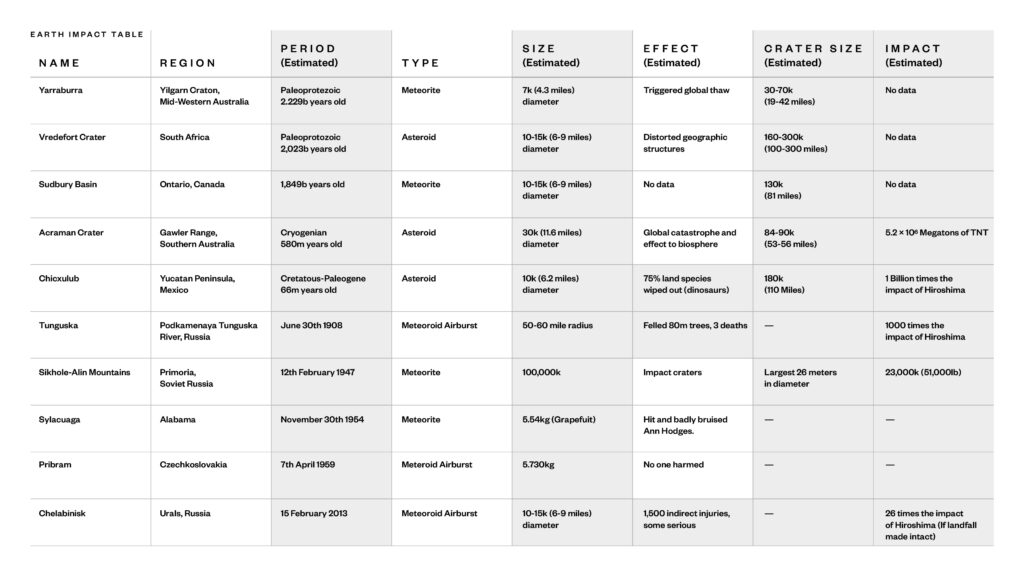
I have selected two periods to explore data in: Prehistoric and 20/21st century. I have also kept it to a minimum of 10 examples to add simplicity to the visualisation of the information and the data contained within. There are 4 key clear channels from which to extract the data: period, size of asteroid, meteoroid and meteor, size of crater and impact measurement.
One key insight from this process so far is that even though a meteoroid can be large in size it can still have a relatively small impact depending on its density, speed and the angle of its trajectory. This is borne out by the Chelabinisk Meteoroid which, even though as large as some of the asteroids that impacted and altered the course of the earth's history, was fairly benign when it was broken up in an airburst explosion on entering the earth's atmosphere.
—
Create a piece of information design to communicate its information and reveal a new insight.
SKETCHES
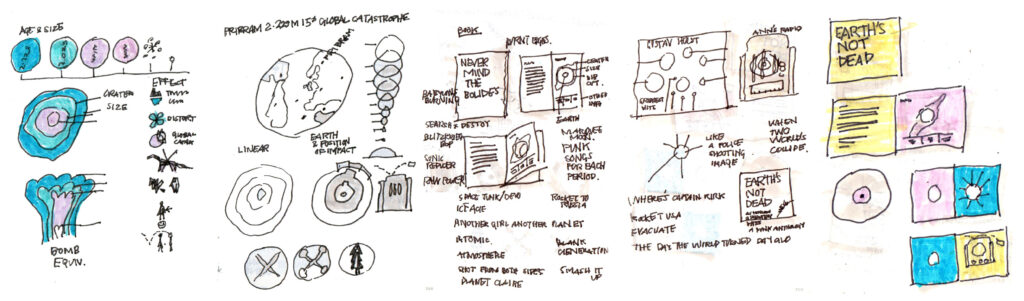
I explored a series of rough sketches to try to give me an idea of how I would like to present the information. I liked the Minard graph where all the information is contained within the one diagram but think there are too many variables in my data to overlay this into the one infographic. I explored breaking it down into it's individual statistical information to create a series of diagrams with a key but think this will be too much information for the viewer to take in, although I do think some separation is necessary. I also thought about breaking it down into a simple linear chart using icons, scale and crater contours to present the information. While this minimalist approach could be interesting from a visual perspective it doesn't allow me to show all the data within the one design and would still result in multiple charts.
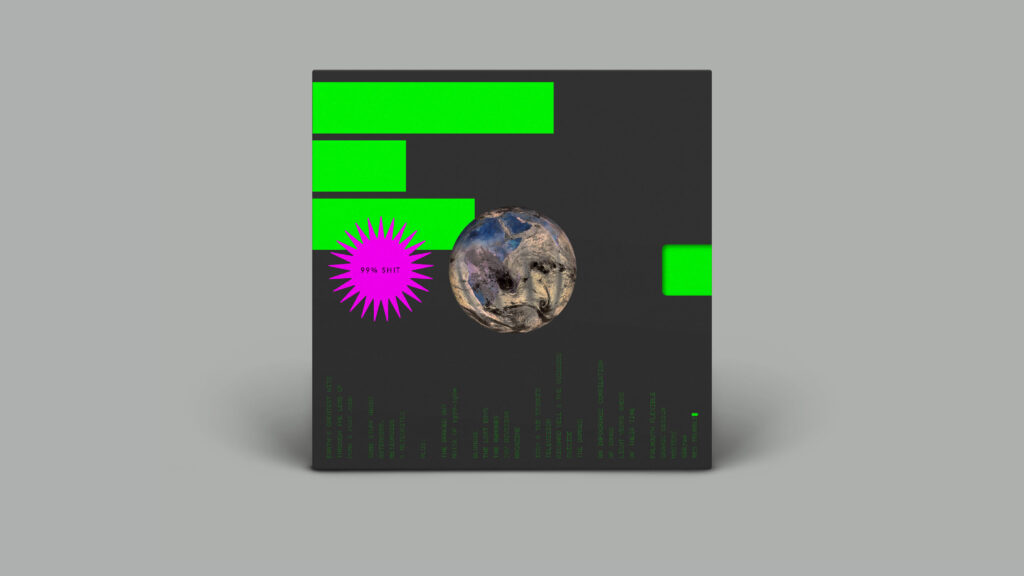
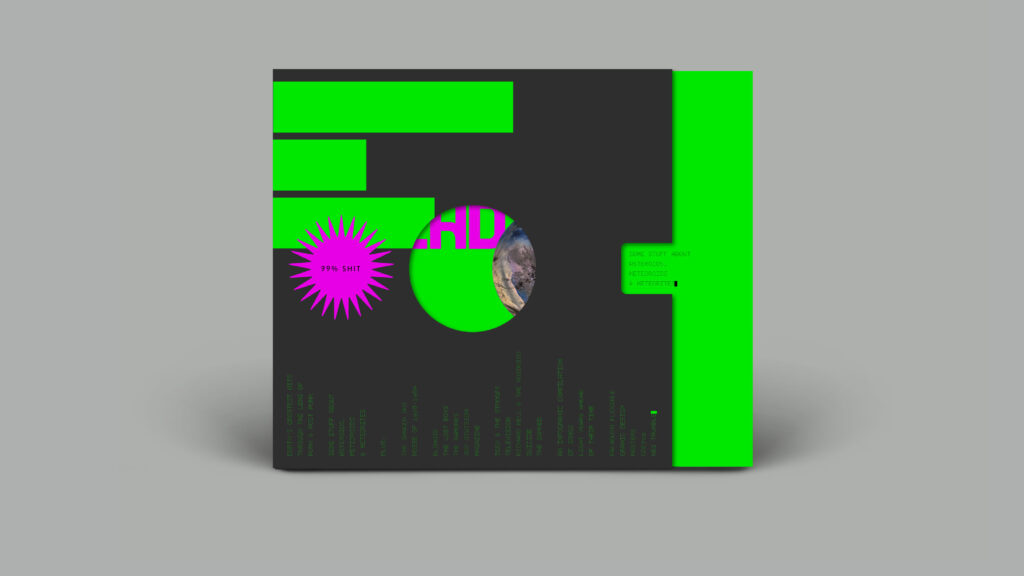
In Joe's lecture the most successful data was supported with text, images and diagrams to give a more rounded, contextualised overview. I then thought about the possibility of having an infographic for each impact event. I think this will create more clarity and the information will come to the fore. I also thought about displaying the bolide sizes by die-cutting a series of holes in the publication. This allows you to look into the whole book and make scale comparison over specific time periods.
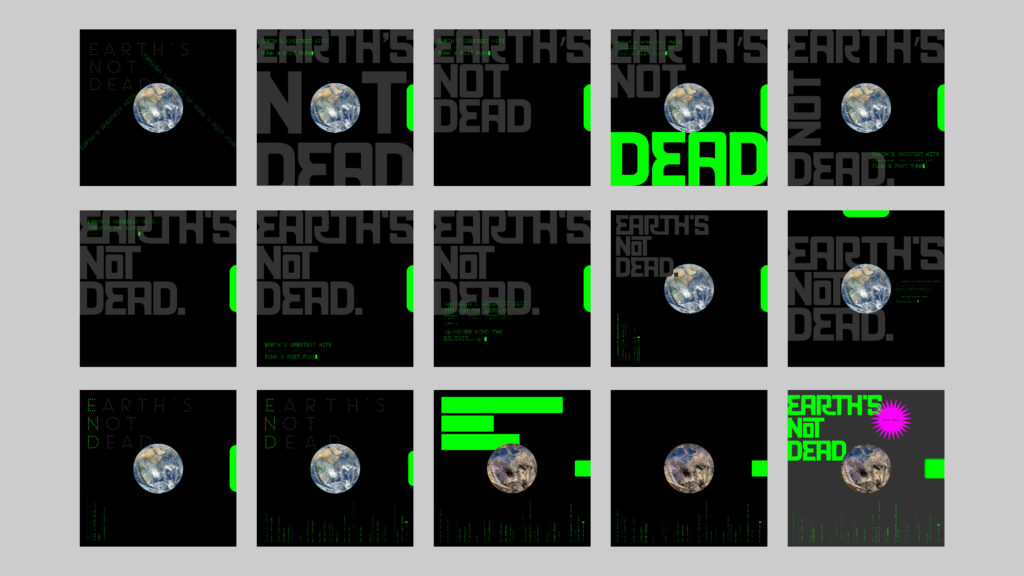
I thought it would be a great Idea to combine this idea with my goal to produce creative for the music industry. I came up with the line 'never mind the bolides', a play on 'never mind the bollocks'. This led me to aligning songs with each impact event with the outcome in a record and book insert format. I am not sure what new insights will come out of this process but will strive towards finding a new discovery within.
—
Final Outcome
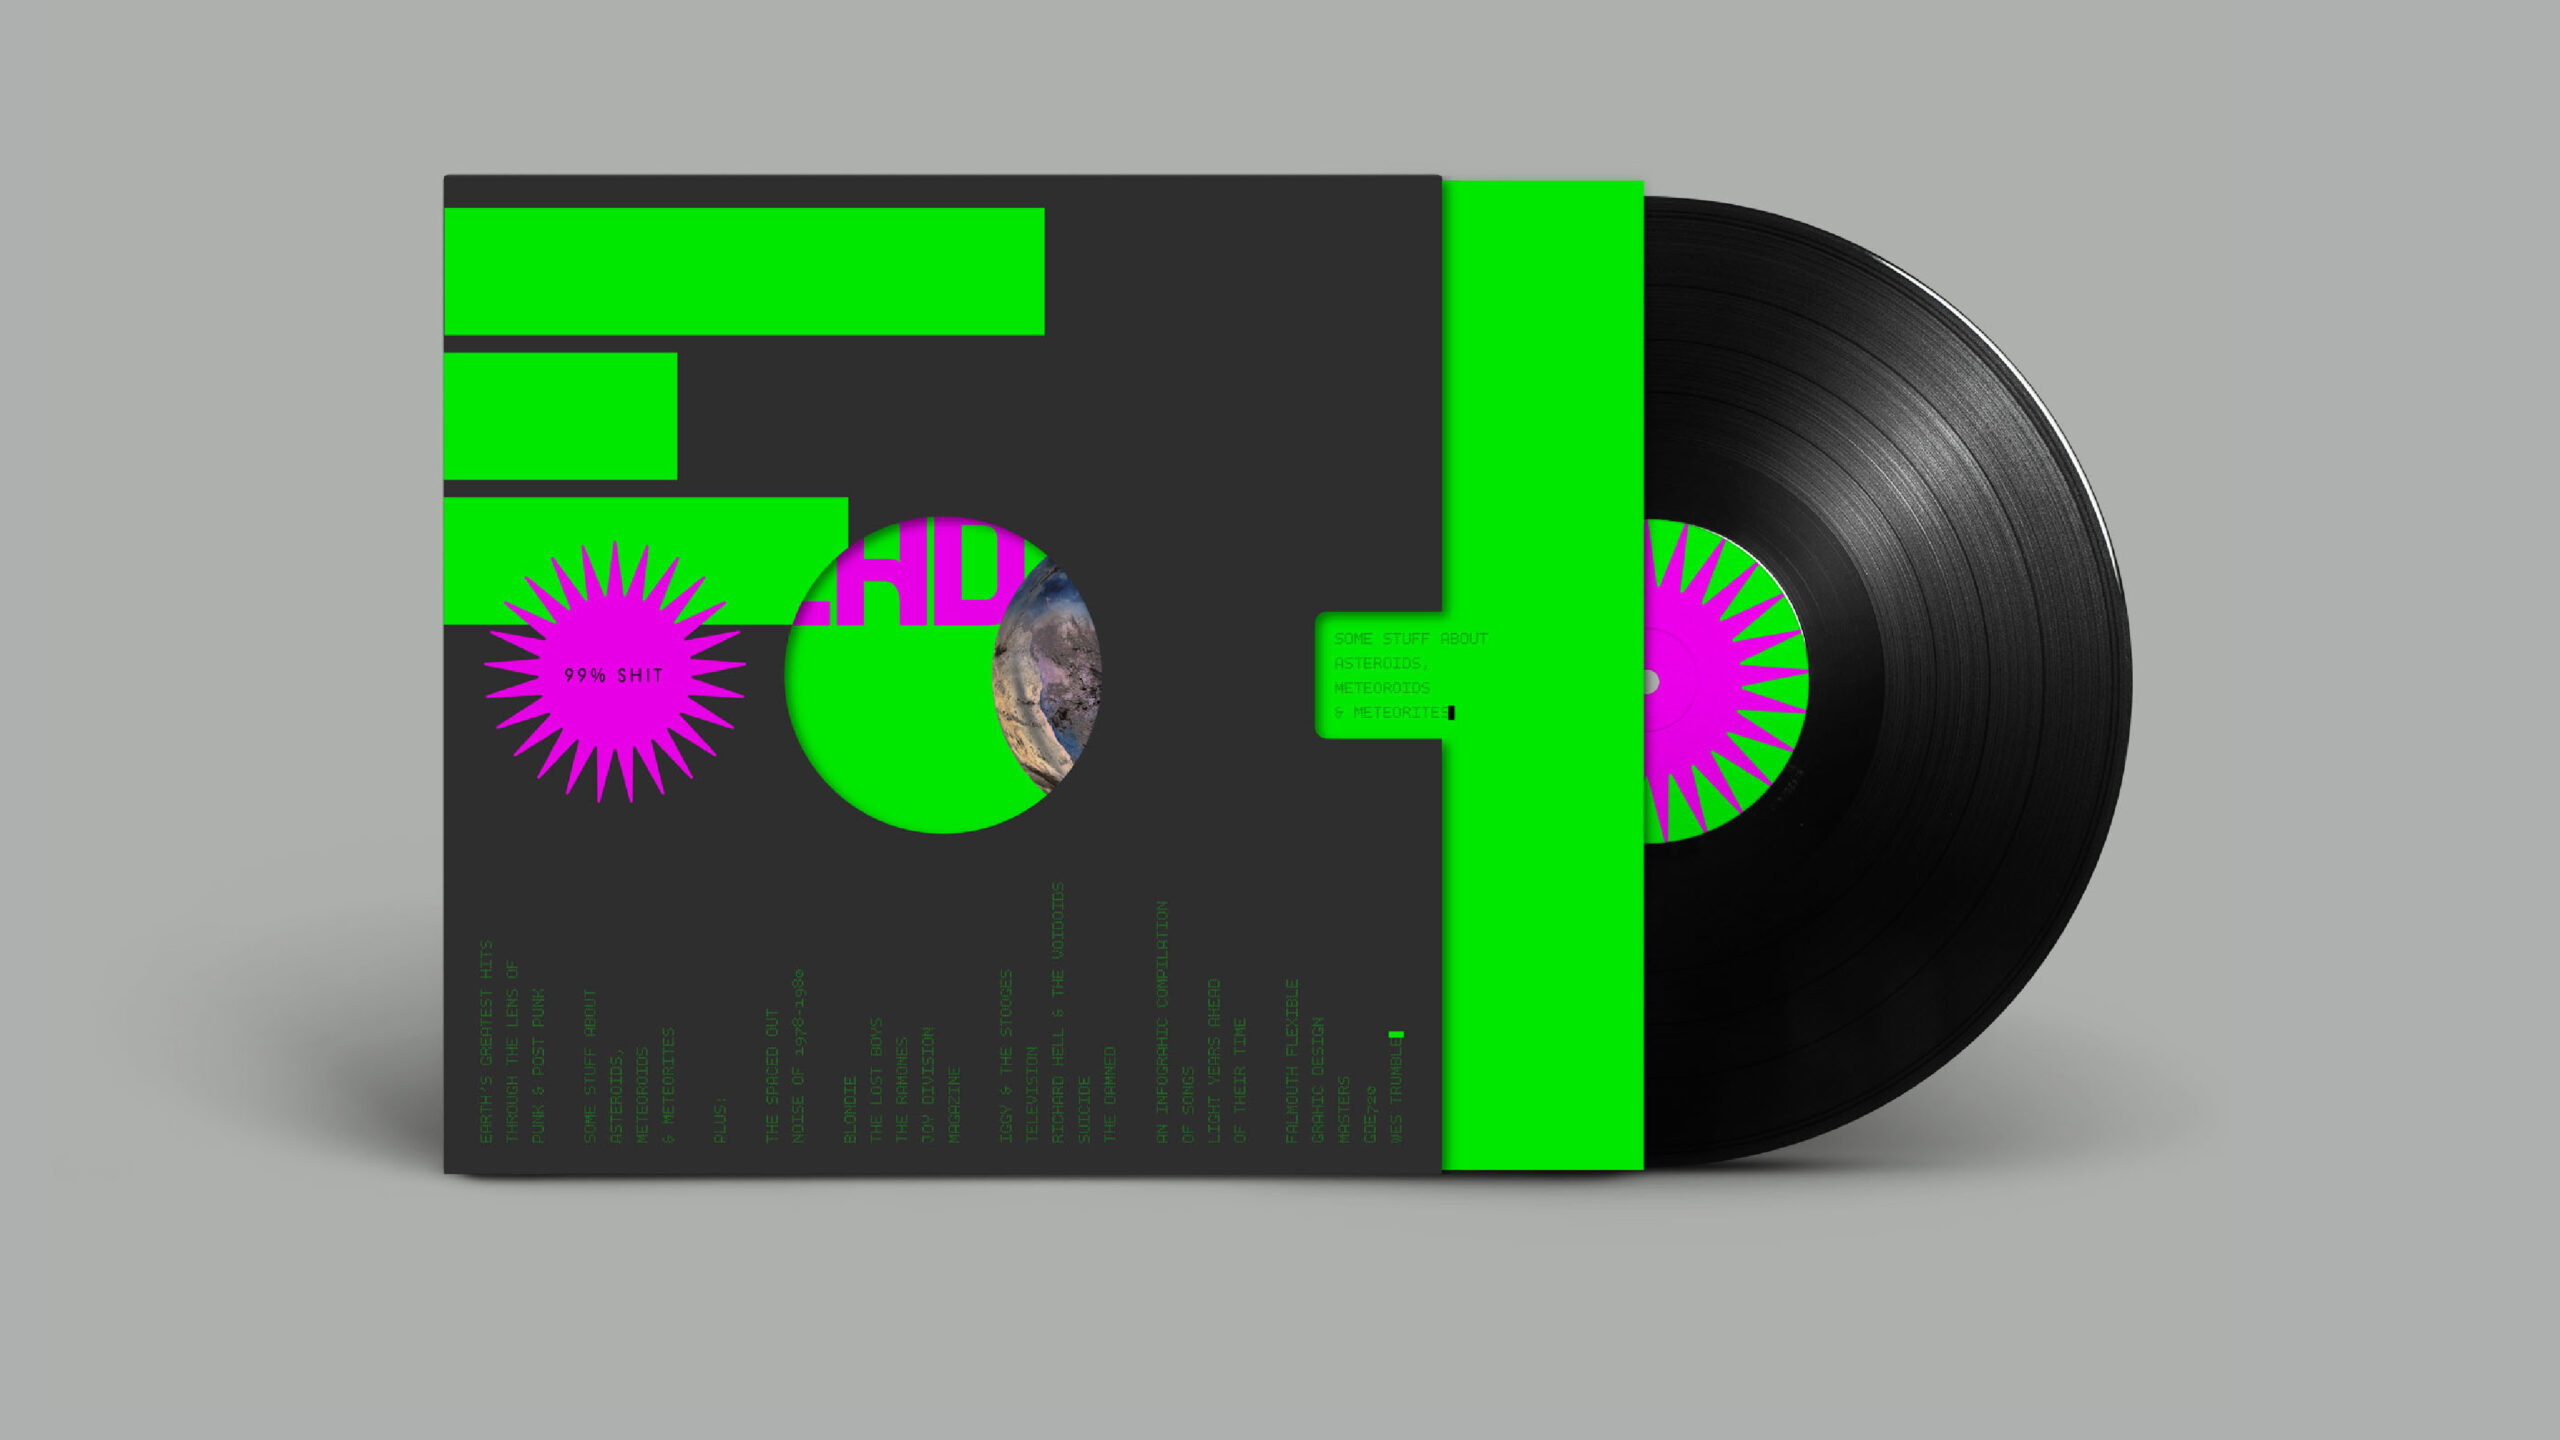
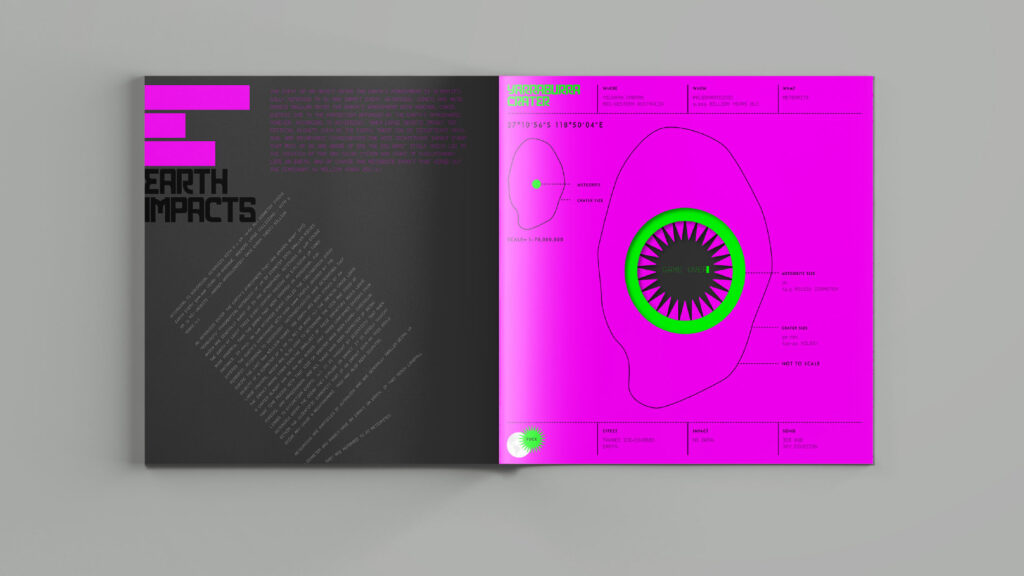
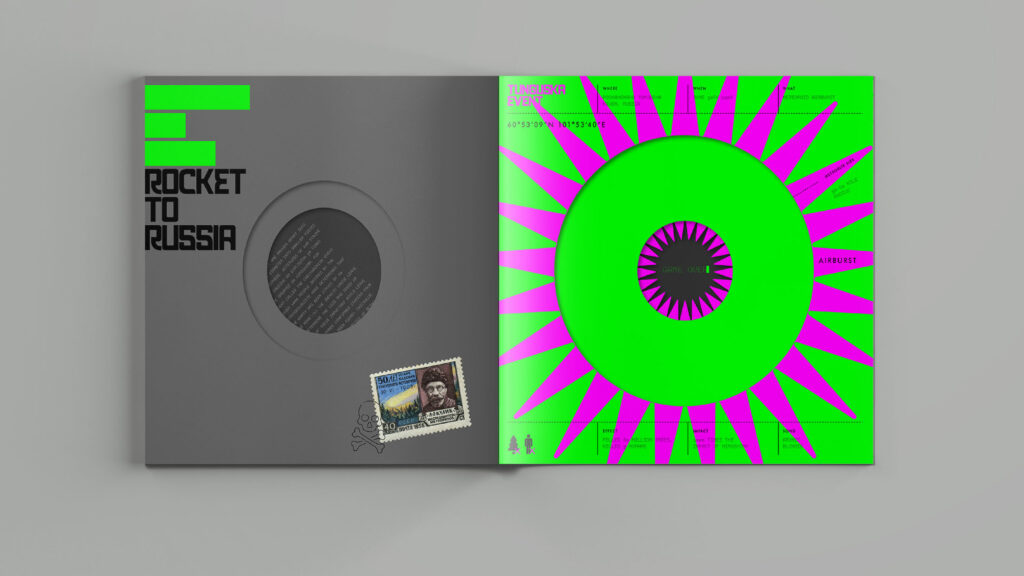
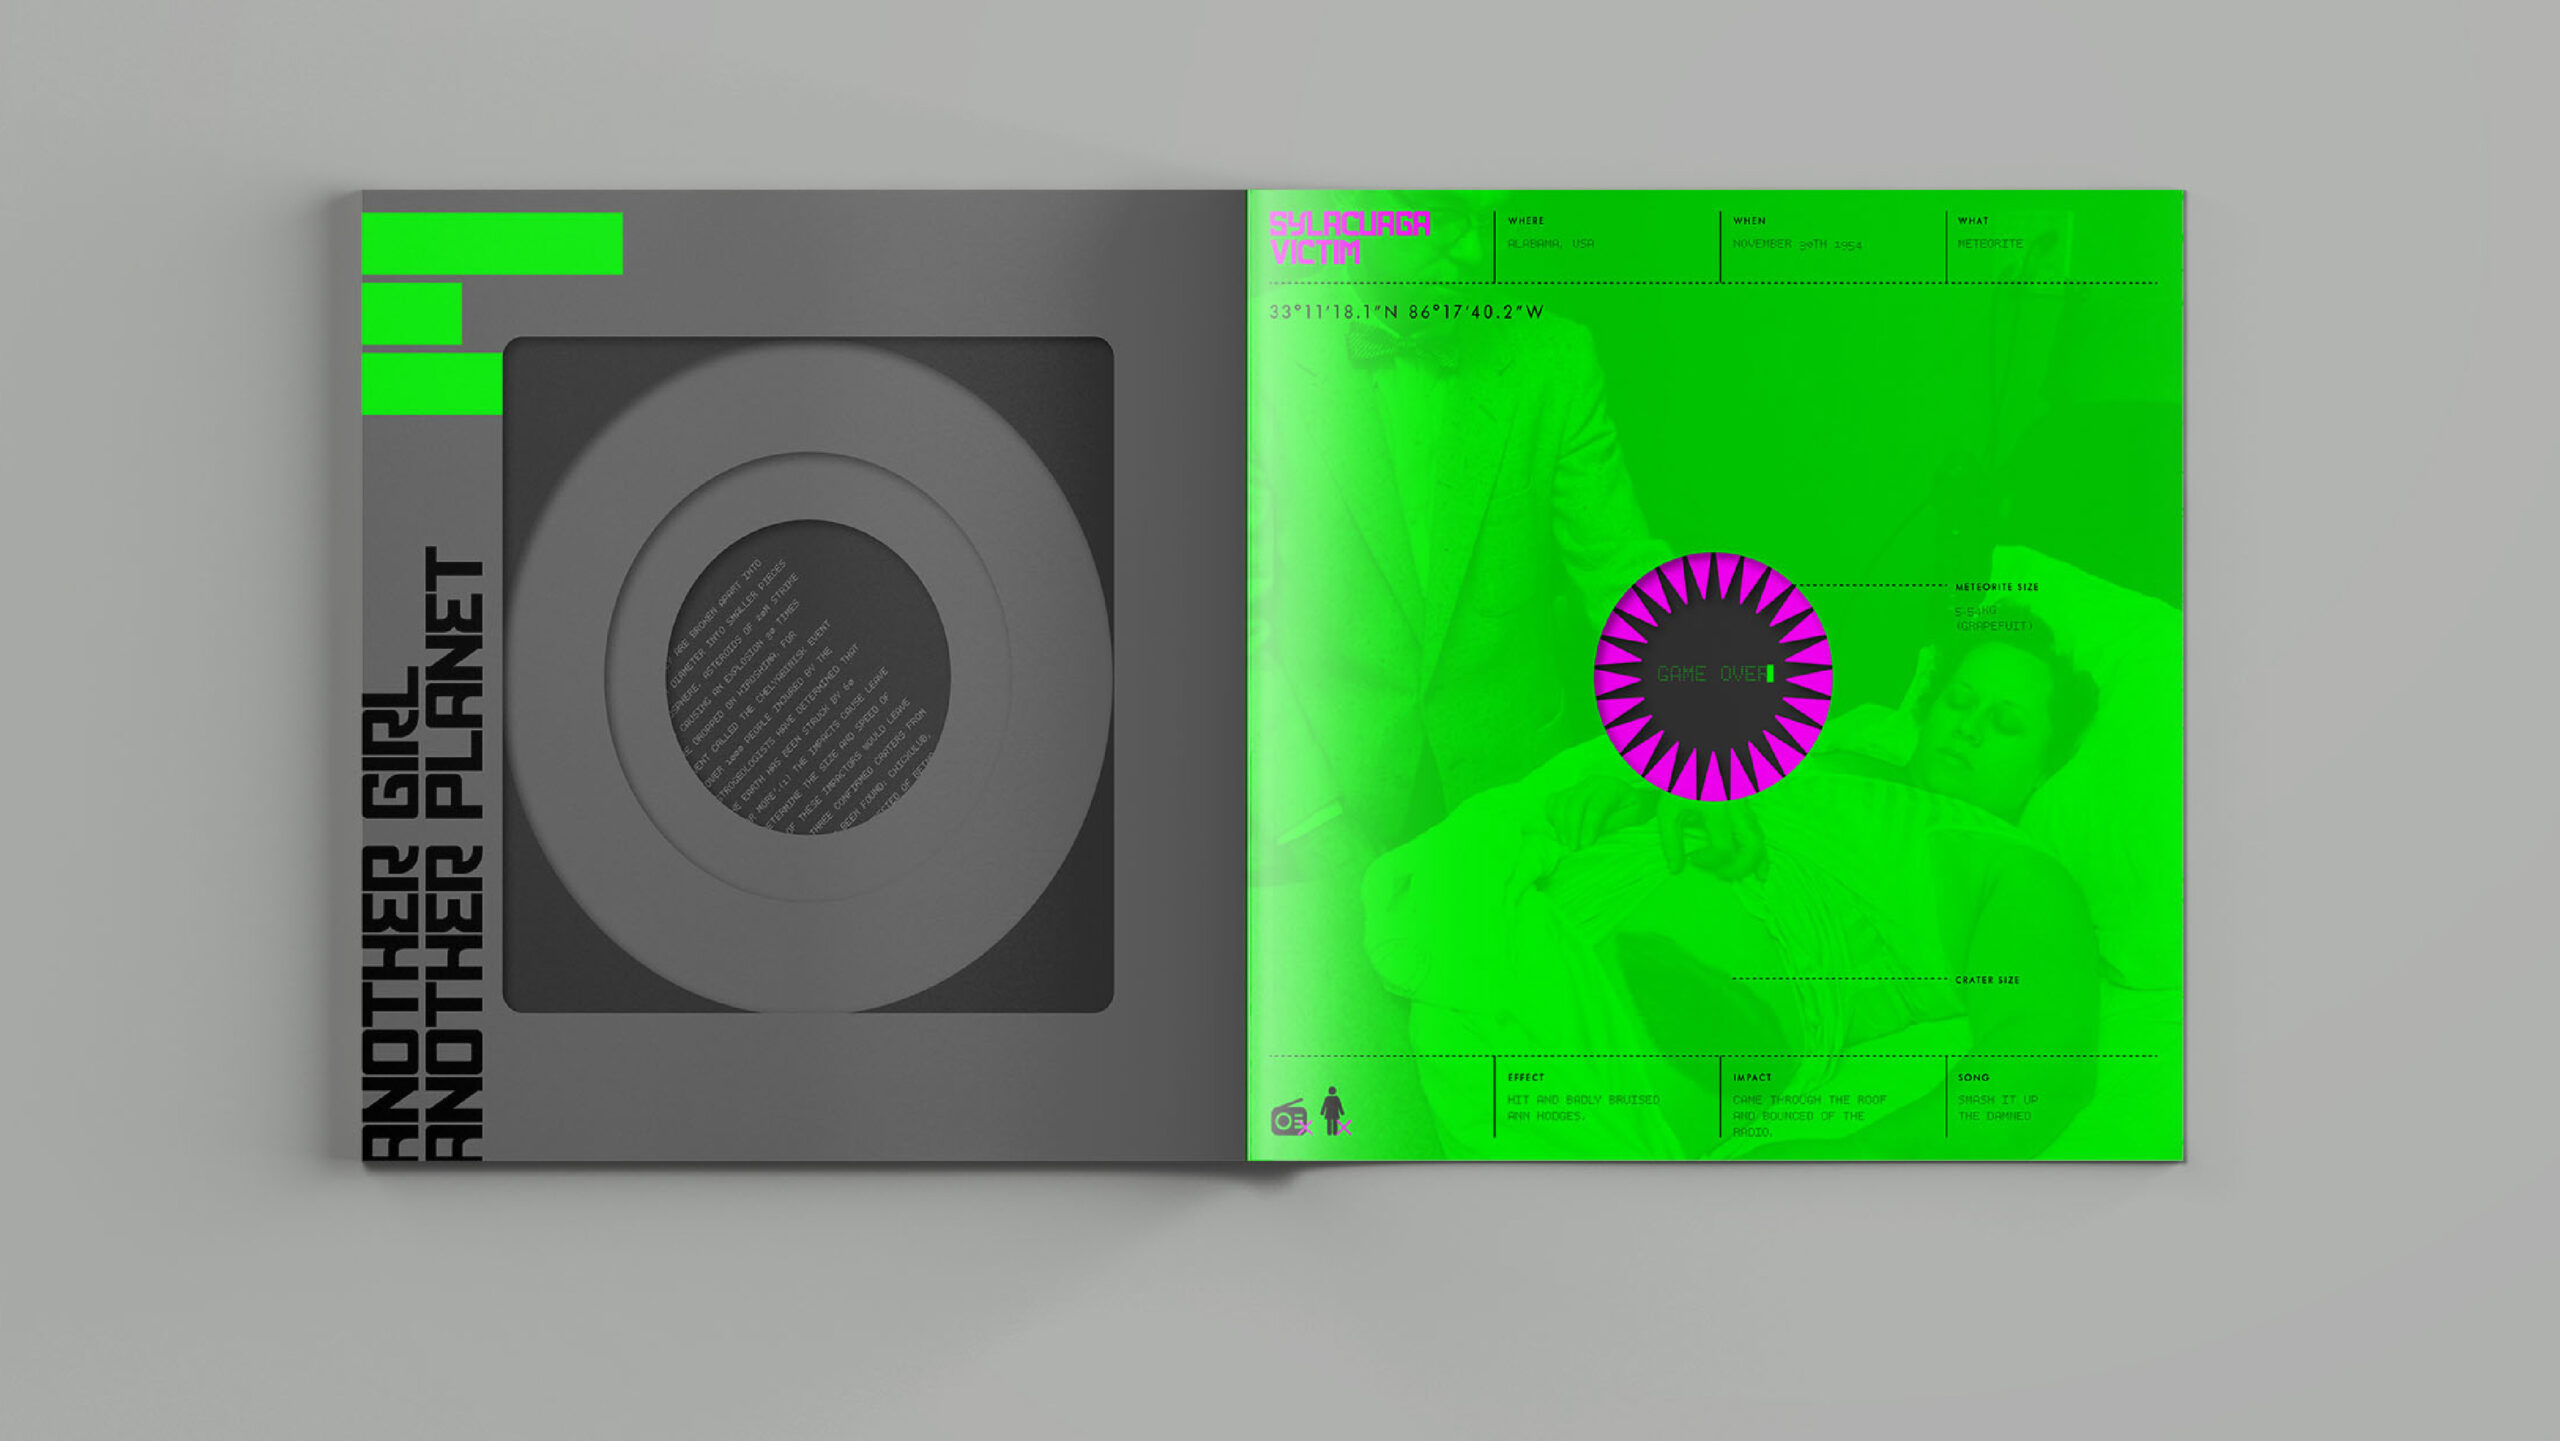
ABOVE: Pages 16 & 17 showing die holes created by Asteroids, Meteoroids and Meteorites left and right.
—